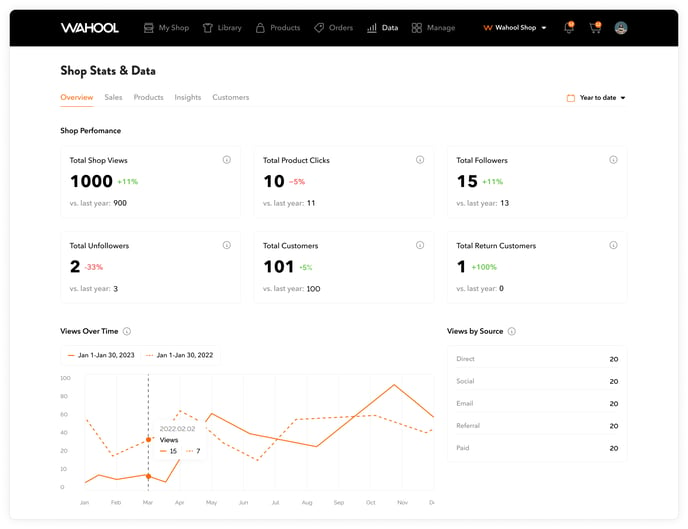
The "Overview" tab provides you with a high-level view of your shop performance. By analyzing the data , you can gain insights into the effectiveness of your marketing efforts, identify trends, and make data-driven decisions to grow your business.
Table Of Contents
- Performance Metrics
- Views Over Time
- Views By Source
- Engagements Over Time
- Engagements By Source
- Traffic Map
- Top Traffic Areas
Shop Performance Metrics
Directly under the tab, you'll find various metrics that provide a snapshot of your shop's performance. For example, you can see how many people visited your shop, how many clicked on a product, and more. Each data point is accompanied by a brief explanation of what you are looking at and how that number was calculated, making it easier for you to understand the data and its implications.
Let's quickly review each of these metrics:
-
Total Shop Views: This metric shows how many people have viewed your shop's page over a given period of time. It's important to monitor this metric because it indicates the level of interest in your shop and its products. If you notice a drop in shop views, you may want to investigate why and make changes to your marketing or product offerings to drive more traffic.
-
Total Product Clicks: This metric shows how many times people have clicked on your products to view them in more detail. It's important to monitor this metric because it indicates how interested people are in your products. If you notice a high number of clicks but low sales, you may want to investigate the product descriptions, pricing, or images to make sure they are effectively conveying the value of the product.
-
Total Followers: This metric shows how many people have followed your shop's page. It's important to monitor this metric because followers can be valuable for building brand awareness and loyalty. If you notice a drop in followers, you may want to investigate why and consider strategies to engage with your audience more effectively.
-
Total Unfollowers: This metric shows how many people have unfollowed your shop's page. It's important to monitor this metric because it can help you understand why people are disengaging with your brand. If you notice a high number of unfollowers, you may want to investigate the content you are posting or the way you are interacting with your audience.
-
Total New Customers: This metric shows how many new customers have made purchases from your shop over a given period of time. It's important to monitor this metric because new customers can be an indication of how effective your marketing efforts are at reaching new audiences. If you notice a low number of new customers, you may want to consider adjusting your marketing strategies or offering promotions to incentivize new customers to purchase from your shop.
-
Total Return Customers: This metric shows how many customers have made repeat purchases from your shop over a given period of time. It's important to monitor this metric because it indicates how effective your customer retention strategies are. If you notice a low number of return customers, you may want to investigate why and consider implementing loyalty programs or other strategies to encourage repeat purchases.
Overall, the "Overview" tab provides you with valuable insights into your shop's performance and helps you make data-driven decisions to grow your business. So, be sure to review this section regularly and use the data presented to optimize your shop's performance.
Pro Tip
By reviewing the data presented in the "Overview" tab on a regular basis, you can identify areas where you need to focus your efforts. For example, if you notice a drop in the number of visitors to your shop, you may need to adjust your marketing strategies to drive more traffic. On the other hand, if you see a spike in sales, you may want to investigate what caused the increase and replicate those efforts to continue driving sales.
How To Read The Metrics
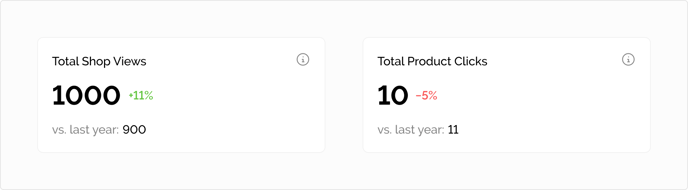
The big, bold number you see on the dashboard represents the current value of the data point you are viewing, based on the date range you have selected. For example, if you are looking at today's data, the number will show the current value for today.
To the right of the big number, you'll see the growth percentage. This percentage is calculated based on the data you are viewing in the date selector, compared to the previous period in the date selector. For instance, if you are looking at today's data, it will calculate yesterday's value and indicate whether the number increased or decreased. The percentage is shown in green if the number has gone up, and red if it has gone down.
Below these numbers, you'll see the "Comparison to" value, which tells you how the current data point compares to the previous date range. For example, if you have selected today's data, it will show a comparison to yesterday's data. If you have selected yesterday's data, it will show the comparison to the day before yesterday, and so on.
By using this information, you can quickly identify trends and patterns in your data, and make informed decisions about your shop's sales strategy. So, be sure to review this section regularly and use the data presented to optimize your shop's performance.
Shop Growth Calculation
Calculating your shop's growth percentage is easy and useful for any shop owner. To calculate the growth percentage between two values, you can use the following formula: [(new value - old value) / old value] x 100
Let's use the Shop Views example from above to find out how much the shop grew between two time periods, like last year and this year, follow these simple steps:
-
Count how many times people looked at your shop last year. In our example, it was 900. This is called the "old value."
-
Count how many times people looked at your shop this year. In our example, it was 1000. This is called the "new value."
-
Subtract the old value from the new value. In our example, it's 1000 - 900 = 100.
-
Divide the result by the old value and multiply by 100 to get the percentage. In our example, it's (100 / 900) x 100 = 11%. This means your shop grew by 11% from the year before!
Views Over Time:
Dive into the specifics of when things are happening and understand when your shop is most active and where it could use some work. The "Shop views over time" graph allows you to see how your shop's activity has changed over time. The x-axis represents time, and the y-axis represents the number of shop views.
The data you are viewing on the chart will display two separate lines which show you the current date period vs the compare time period. The solid line shows the current date period, while the dotted line shows the compare time period. By comparing the two lines, you can identify trends and patterns in your shop's views and adjust your strategy accordingly.
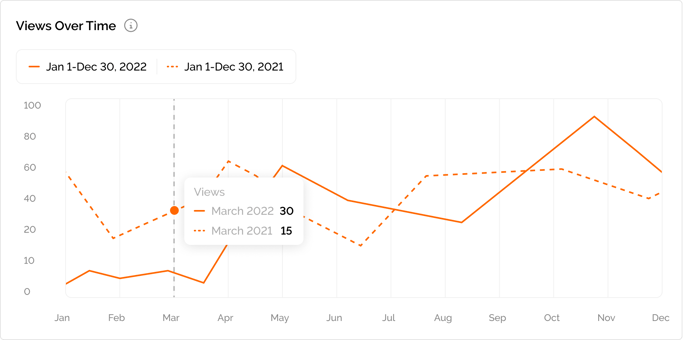
Overall, views Over Time is a valuable metric for understanding your shop's activity changes. The graph shows how your shop's views have changed over time, and comparing it to a previous period can identify trends and patterns. Analyzing significant changes can help plan marketing efforts and optimize shop performance.
From the graph, you can draw insights such as:
-
Peak times of shop views: This can help you identify when your shop is most active and can adjust marketing efforts or promotions accordingly.
-
Declining views: If there is a downward trend in shop views, it may be time to reassess your marketing strategy or product offerings.
-
Spike in views: If there is an unusual spike in views, it could be due to a promotion or new product launch. You can analyze what caused the spike and replicate it in the future.
Pro-Tip
Take note of any significant increases or decreases in shop views and investigate what might have caused them. For example, did you run a promotion or launch a new product during that timeframe? Understanding the factors that affect your shop's views can help you plan your marketing and promotional efforts more effectively.
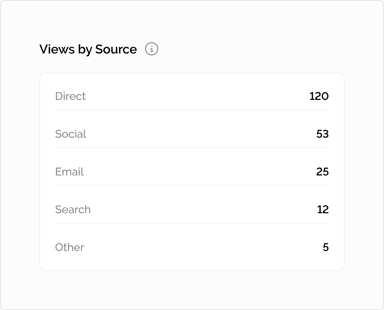
Views By Source:
Want to know where your visitors are coming from, you can do so with our views by source table.
-
Direct: Refers to website visitors who come directly to your site by typing in your website address or clicking on a bookmarked link. These visitors are already familiar with your brand and have intentionally sought out your website.
-
Social: Refers to website visitors who come to your site through social media platforms like Facebook, Twitter, Instagram, or LinkedIn. These visitors have clicked on a link to your website from a social media post or advertisement.
-
Email: Refers to website visitors who come to your site through a link in an email campaign. These visitors have received an email from your brand and clicked on a link to your website included in the email.
-
Search: Refers to website visitors who come to your site through search engine results. These visitors have searched for a particular keyword or phrase related to your brand, and your website appeared in their search results.
-
Other: Refers to website visitors who come to your site through sources that don't fit into any of the above categories. This can include visitors who have clicked on a link from another website, from an online advertisement, or from a referral program.
Pro Tip
Use the Views By Source data to understand where your visitors are coming from and tailor your marketing strategy accordingly. If you notice that a large percentage of your visitors are coming from social media, consider investing more resources into your social media marketing efforts.
If your search traffic is low, try optimizing your website for search engines or running paid search ads to increase visibility. Understanding where your traffic is coming from can help you make informed decisions about where to focus your marketing efforts and ultimately drive more traffic and sales to your shop.
Engagements Over Time:
"Engagements Over Time" is a metric that tracks the number of new followers, customers, and visitors your Wahool shop acquires over a specific period. By measuring engagements over time, you can analyze the growth of your customer base and identify trends in customer behavior. This information can help you make data-driven decisions to optimize your marketing strategies and grow your business.
-
New Customers: Total new e-commerce customers refer to the number of unique individuals who made their first purchase from your Wahoo shop.
-
New Followers: Total number of followers refers to the number of people who have chosen to follow or subscribe to your Wahool shop.
-
New Visitors: The number of different people who looked at your Wahool website, even if they looked at it more than once. We count each person only one time, even if they visit the website many times.
To visualize the data, the engagements over time metric is often represented using a line graph. The graph will have three solid lines labeled with the source of traffic, such as direct, social, and email. These lines allow you to compare the engagements with each other and draw conclusions on when your shop gets its most engagement, and how it compares to sales.
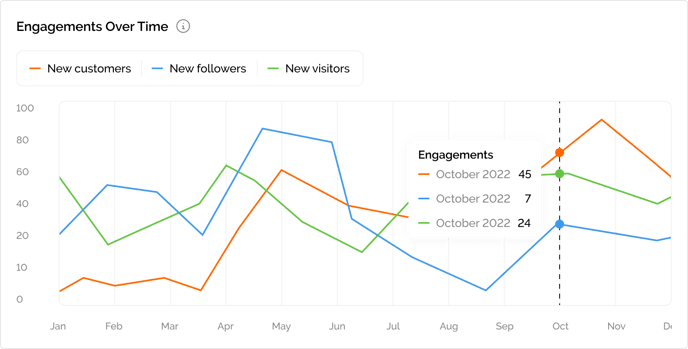
In conclusion, "Engagements Over Time" is a valuable metric to help you monitor the growth of your customer base and understand customer behavior. By visualizing the data in a line graph and comparing the different sources of traffic, you can gain insights into when and how your shop is getting the most engagement, and use this information to make informed decisions to grow your business.
Pro Tip
If you notice that the social line has a sudden spike in engagements over a specific period, you may want to investigate what caused the spike, such as a successful social media campaign or influencer collaboration. You can then use this information to adjust your marketing strategies to maximize engagement and drive more sales.
Engagements By Source:
This metric refers to the number of new followers, new customers or visitors acquired through your Wahool shop, grouped by the source of traffic such as direct, social, email, search or other. Make sure to toggle between the tabs to view the different data across these three metrics.
"Engagements By Source" is a metric that provides insight into the sources of traffic to your Wahool shop. This metric allows you toggle between your new followers, new customers, and new visitors acquired through your shop by the source of traffic, such as direct, social, email, search, or other.
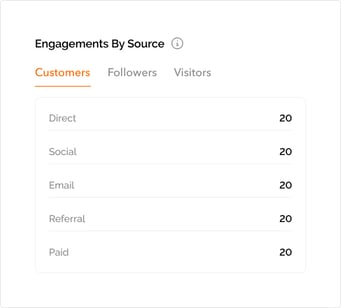
Overall, "Engagements By Source" is a valuable metric to help you make data-driven decisions to optimize your marketing strategies and grow your business. You can track this metric using various analytics tools such as Google Analytics, social media analytics, or your own shop's analytics dashboard.
Pro Tip
By tracking engagements by source, you can analyze the effectiveness of your marketing efforts and identify which sources are driving the most traffic and engagement to your shop. For example, if you notice that a significant percentage of your new customers are coming from social media, you may want to focus more on social media marketing strategies to continue driving traffic to your shop.
Additionally, by monitoring engagements by source over time, you can identify any trends or changes in customer behavior. For instance, if you notice a sudden increase in direct traffic, it may indicate that your brand awareness is growing, or that your customers are returning to your shop directly.
Views By Location:
The "Views By Location" metric provides valuable information about the geographic distribution of your Wahool shop's traffic. By analyzing this data, you can identify which regions of the United States are most interested in your products, and tailor your sales strategy accordingly.
The heat map displays traffic density in different shades - darker shades mean more traffic and lighter shades mean less traffic. This data can help you identify which regions of the United States are most interested in your products. This data can help you identify which regions of the United States are most interested in your products.
Overall, the "Views By Location" metric provides an important glimpse into your customer base, and can help you make data-driven decisions to improve your sales strategy and grow your business.
Pro Tip
If you notice that your shop receives a significant number of views from customers in a particular state or region, you may want to consider offering promotions or targeted marketing campaigns to that area. You could also use this information to adjust your product offerings to better meet the needs and preferences of customers in that region.
On the other hand, if you notice that your shop is receiving relatively few views from certain areas, you may want to investigate why this is the case. It could be that your products are not as relevant to customers in those regions, or that you need to adjust your marketing strategy to better target those areas.
Top Traffic Areas:
The "Top Traffic Areas" metric provides valuable information about the most popular US cities where your Wahool shop site is being visited. By analyzing this data, you can identify which areas of the country are most interested in your products, and tailor your sales strategy accordingly.
Overall, the "Top Traffic Areas" metric provides an important glimpse into your customer base, and can help you make data-driven decisions to improve your sales strategy and grow your business. With this information, you can make informed decisions about how to allocate your marketing resources and focus your efforts on the regions where you are most likely to find success.
Pro Tip
If you notice that your shop receives a significant number of views from customers in a particular city or region, you may want to consider offering promotions or targeted marketing campaigns to that area. You could also use this information to adjust your product offerings to better meet the needs and preferences of customers in that region.
On the other hand, if you notice that your shop is receiving relatively few views from certain areas, you may want to investigate why this is the case. It could be that your products are not as relevant to customers in those cities, or that you need to adjust your marketing strategy to better target those areas.