Use the product performance data to identify top-selling and under-performing products, make informed sales strategy decisions, and determine which products to promote or update.
The Product Performance section of the data dashboard provides you with valuable insights into how each product is performing. It highlights the best-selling products and the under-performing products, enabling you to make informed decisions about your sales strategy.
By analyzing the data in this section, the you can determine which products are driving sales and which ones are not resonating with your customers. This information is crucial in making informed decisions about which products to promote or feature on the shop's homepage, as well as which products may need to be updated or discontinued.
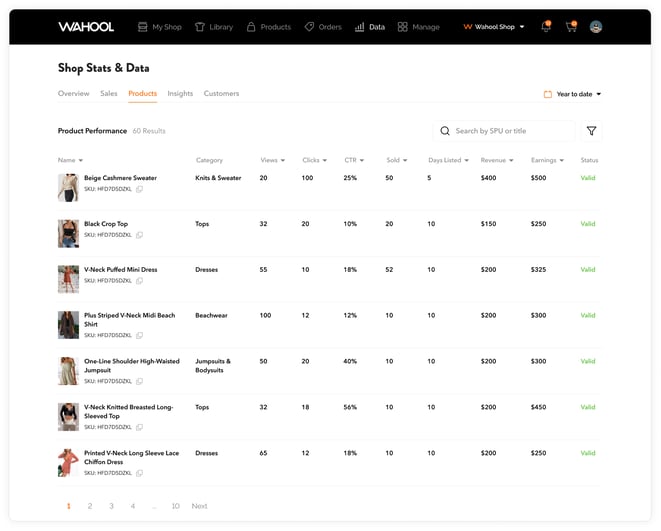
Let's quickly go over the product metrics available to you:
-
Days Listed In Shop: This metric indicates the number of days that a particular product has been listed in your shop. This can help you understand how long it takes for a product to sell, and if there are any seasonal or cyclical patterns in its performance.
-
Views: This metric indicates the number of times a product page has been viewed by potential customers. High views indicate a product is attracting attention, but low views may suggest that the product needs to be marketed better.
-
Clicks: This metric indicates the number of times a potential customer clicked through to view a product page. High clicks indicate that your product is being seen by potential customers, but low clicks may indicate that your product is not well-targeted.
-
CTR (Click-Through Rate): This metric is the percentage of people who click on a product link compared to the number of people who see it. A high CTR indicates that your product is compelling and that your marketing efforts are effective. To calculate CTR, you need to divide the number of clicks by the number of views, and then multiply by 100 to get the percentage.
-
Sold: This metric indicates the number of units of a particular product that have been sold. This is a key metric that helps you understand how successful a product is in generating revenue.
-
Revenue: This metric indicates the total amount of money that a particular product has generated in sales. This is important because it helps you identify the most profitable products in your shop and make informed decisions about pricing, inventory, and marketing.
-
Earnings: This metric indicates the total amount of money that a particular product has generated in profits, which is revenue minus the cost of goods sold and any other expenses. This is important because it helps you understand the profitability of your products and make informed decisions about future investments.
Sorting and Filtering
With the ability to filter, sort, and search the list of products, you have complete control over how you view your product performance data. This can help you quickly identify trends and patterns in your sales, such as which products have the most views, clicks, sales, CTR, revenue and earnings.
Sorting and filtering the data in the Product Performance section of the data dashboard can be incredibly helpful in identifying trends and patterns in your sales. By clicking on the title of each metric, such as Views, Clicks, Sold, Revenue, and Earnings, you can sort the data in either ascending or descending order.
For example, sorting by the number of views can show you which products are getting the most attention, while sorting by the click-through rate (CTR) can help you identify which products are most compelling to potential customers. You can also filter the data by specific products or categories to get a more focused view of their performance.
Sorting and filtering the data allows you to quickly identify which products are performing well and which are not. This can help you make informed decisions about your sales strategy, such as which products to feature more prominently on your homepage or which products may need to be updated or discontinued.
For example, if a particular product is consistently under-performing, the shop owner may need to consider updating its product description, changing its price, or adding new images. On the other hand, if a product is performing well, the shop owner can allocate more resources to promoting it, creating a bundle deal with other products, or featuring it more prominently on the homepage.
Overall, the Product Performance section of the data dashboard provides the shop owner with a deep understanding of how their products are performing, allowing them to optimize their sales strategy and drive success. It is an essential tool for any e-commerce business looking to increase sales and revenue.
Pro Tip
When analyzing your product performance metrics, consider not only the numbers but also the context behind them. For example, if a product has a low CTR, it may be because the product description is not clear or the product images are not appealing enough. Take the time to review and update the product listing with high-quality images, a detailed product description, and customer reviews to make it more attractive to potential buyers.
Additionally, pay attention to seasonal or holiday trends that may affect the demand for certain products. Use this data to plan your inventory and marketing strategy accordingly, and you may see a significant increase in sales and revenue.