The Data Dashboard is a new feature that provides analytics and insights into shop's performance, sales, products, and customers to help businesses make data-driven decisions and improve their strategies
We're excited to announce a major update and feature that we recently added to both our desktop and mobile app – the new Data Dashboard! Our goal with this dashboard is to help you enhance your shop experience by providing rich analytics that can help you adapt your strategy and grow your business.
The Data Dashboard is divided into four areas, each providing valuable insights to help you make data-driven decisions. These areas include the Shop Performance Overview, Sales Performance, Product Listing Performance, and Customer Data Insights. Locate the Data Dashboard from the main Navbar in Desktop and under Applications in Mobile on the home page.
The Data Dashboard: The Ultimate Tool to Enhance Your Shop Experience
As an online shop owner, you're always looking for ways to grow your business and improve your sales strategy. But how do you know what's working and what's not? How do you identify areas for improvement and make data-driven decisions? That's where our new feature, the Data Dashboard, comes in.
The Data Dashboard is a powerful tool that provides rich analytics and insights into your shop's performance, sales, products, and customers. It's available on both our desktop and mobile app, and it's designed to help you make sense of the data and take your shop to the next level. Let's take a closer look at what the Data Dashboard can do for you.
Overview: A High-Level View of Your Shop's Performance
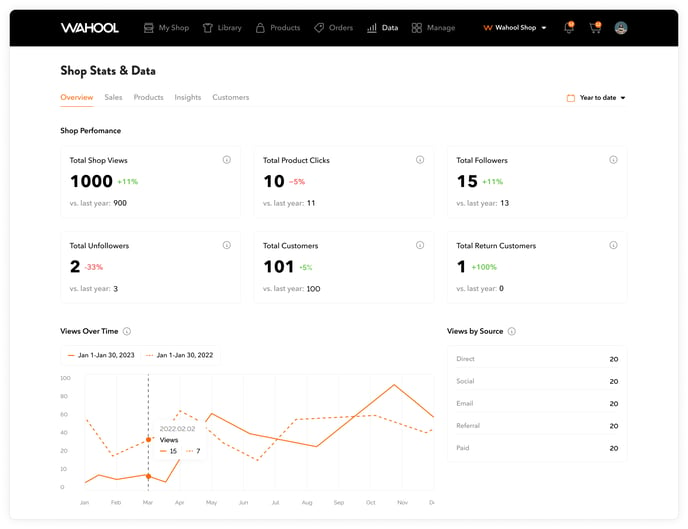
The Overview section of the Data Dashboard provides a high-level view of your shop's performance. It displays various metrics, such as the number of visitors to your shop, the number of clicks on a product, and other important data points. By analyzing this data, you can make data-driven decisions to grow your business.
One of the most useful metrics displayed in the Overview section is "Views Over Time," which shows when your shop is most active and where it needs improvement. The "Views By Source" table provides information on where visitors come from, including direct, social, email, search, and other sources. By understanding where your traffic is coming from, you can optimize your marketing efforts and drive more traffic to your shop.
The "Engagements Over Time" metric tracks the number of new followers, customers, and visitors your shop acquires over a specific period. It helps you monitor the growth of your customer base and understand customer behavior. By comparing different sources of traffic, you can draw conclusions on how to maximize engagement and drive more sales.
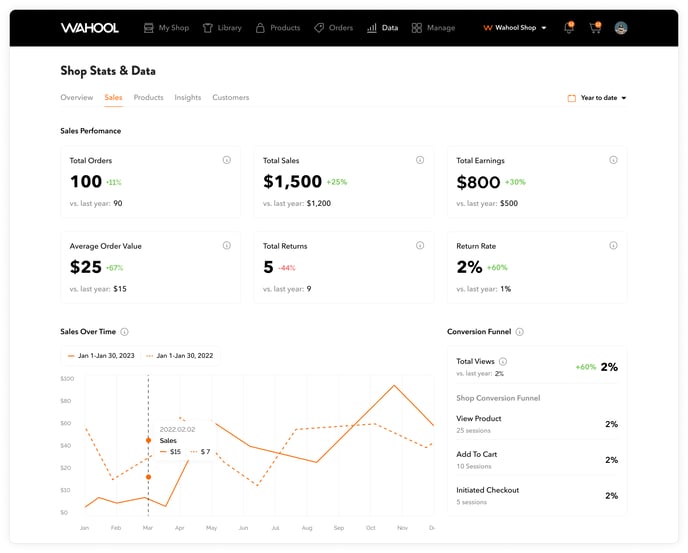
Sales Performance: Analyze Your Shop's Financial Health
The Sales Performance section of the Data Dashboard allows you to analyze your shop's overall sales and conversion metrics. You can track your shop's financial health and identify areas for improvement in your sales strategy. The "Shop Conversion Funnel" tab monitors your conversion rate and identifies specific areas in the checkout process where visitors are dropping off.
By using the data provided in the Sales Performance Metrics section, you can identify areas where you may be underperforming and take action to improve those areas. The "Sales Over Time" tab allows for tracking trends and patterns in sales performance, while the "Orders Over Time" and "Orders By Source" tabs help you analyze the volume of customer purchases and determine the effectiveness of your marketing and advertising efforts.
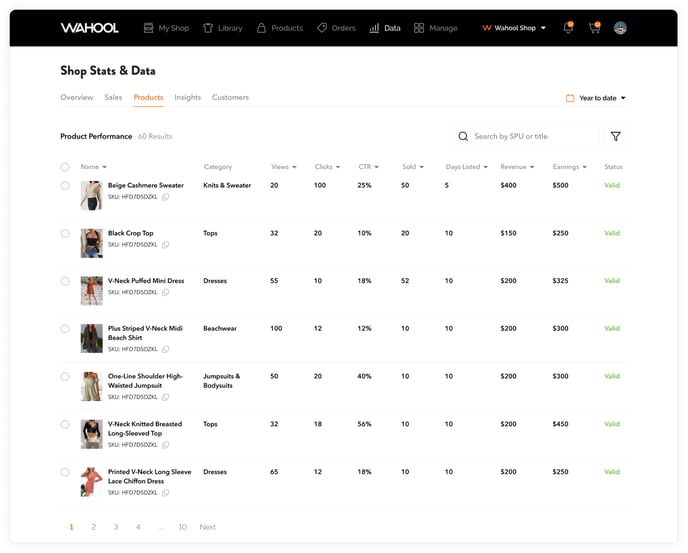
Product Performance: Insights Into How Each Product Is Performing
The Product Performance section of the Data Dashboard provides insights into how each product in your shop is performing. It highlights the best-selling products and the under-performing products, enabling you to make informed decisions about your sales strategy.
With the ability to filter, sort, and search the list of products, you have complete control over how you view your product performance data. By analyzing this data, you can determine which products are driving sales and which ones are not resonating with customers. This allows you to make informed decisions about which products to promote or feature on your shop's homepage, as well as which products may need to be updated or discontinued.
Customer Data: Gain Insight Into Your Customers' Behavior
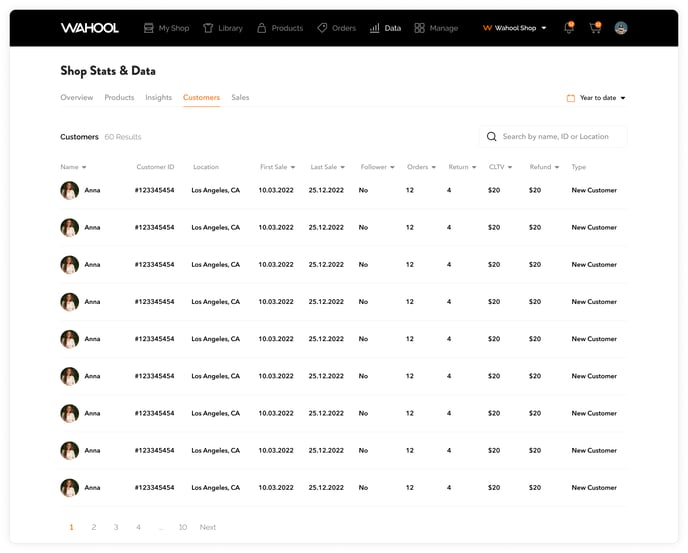
The Customer Data section of the Data Dashboard is a valuable tool that can help you gain insight into your customers' behavior, enabling you to make data-driven decisions to improve customer satisfaction and retention. By analyzing customer data, you can identify trends, track customer loyalty, and tailor your marketing efforts to specific customer segments.
In this section, you can view a variety of metrics related to your customers' purchasing behavior, such as customer location, type, and date of their first and last sale. Additionally, you can see if the customer is following your shop, the number of orders placed versus returned orders, and the Customer Lifetime Value (CLTV), which is the total amount of sales revenue generated by a customer.
Overall, the customer data section provides valuable insights into your customer base and helps you make data-driven decisions to improve customer retention and drive sales. With this information, you can gain a deeper understanding of your customers' purchasing behavior, identify trends, and make informed decisions to grow your business.
The new Data Dashboard is a powerful tool that can help you take your businesses to the next level. With its four major sections, the Overview, Sales Performance, Product Performance, and Customer Data, it provides rich analytics and insights that can help you make data-driven decisions and adapt your sales strategy to better meet the needs of your customers.
By leveraging the data provided by the Data Dashboard, you can identify areas for improvement in your shop's performance, track trends and patterns in sales and customer behavior, and make informed decisions about your marketing and sales strategy. Whether you're a new seller or a seasoned pro, the Data Dashboard can help you get the most out of your experience and help you grow your business.
Overall, we're excited about the potential of the Data Dashboard to help our shop owners succeed, and we encourage you to explore its features and start leveraging its insights to drive your shop's growth. If you have any questions or feedback about the Data Dashboard or any other features of our platform, please don't hesitate to reach out to our support team. We're here to help you succeed!